
Quick Answer
A 90-day rolling cash flow forecast is a week-by-week spreadsheet that tracks every pound coming in and going out over the next 13 weeks. You update it weekly, dropping off the oldest week and adding a new one. It gives you roughly six weeks of warning before a cash crunch hits, which is enough time to chase invoices, delay purchases, or line up a short-term credit facility. Most trades businesses that fail do so because of cash flow, not lack of work. This forecast fixes that.
Table of Contents
- Why cash flow kills more trades businesses than bad workmanship
- What a 90-day rolling forecast actually is
- How to build your forecast step by step
- Software that does the heavy lifting
- Automating your forecast with n8n and Make
- Seasonal patterns every UK trade should plan for
- Late payments and how to forecast around them
- Common forecasting mistakes that cost you money
- What tradespeople are saying
- Recommended videos
- Frequently asked questions
- My verdict
Why cash flow kills more trades businesses than bad workmanship

I ran a heating and plumbing company with six engineers and three apprentices. The thing I learnt fastest was that profit on paper means nothing if you cannot pay wages on Friday. You can have a full diary, five-star reviews, and a growing reputation, and still be three weeks from disaster if your cash flow timing is wrong.
The numbers are stark. According to research from the Federation of Small Businesses and ONS data, 82% of small business failures are linked to poor cash flow management. Construction is the worst-hit sector, with 4,401 insolvency cases in the 12 months to April 2024, accounting for 18% of all insolvencies in England and Wales. That is not because tradespeople do bad work. It is because the gap between paying suppliers and getting paid by customers can swallow a business whole.
The UK late payment crisis makes it worse. A 2025 Coface survey found 95% of construction companies experienced payment delays, with the average delay hitting 38.2 days. Direct Line research from 2024 found the average tradesperson is chasing £6,210 in late payments across seven outstanding invoices. Late payments cost the UK economy nearly £11 billion each year, and an estimated 38 businesses close every day because of them.
A 90-day rolling forecast does not fix late-paying customers. But it does give you visibility. You can see the crunch coming six weeks out instead of six days. That is the difference between making a phone call and making a crisis.
What a 90-day rolling forecast actually is

A 90-day rolling forecast is a spreadsheet with 13 columns, one for each week. Every row is a cash inflow or outflow. Confirmed jobs, estimated jobs, material costs, wages, van payments, insurance, tax set-asides, everything.
The key word is "rolling." Every Friday (or whenever you do your admin), you update the actuals for the week just gone, delete that column, and add a new week 13 at the end. The forecast always looks 90 days ahead. It never goes stale.
This is the direct method of cash flow forecasting. You are tracking actual cash movements, not accounting profit. It is the right approach for trades businesses because you need to know exactly when money lands in your account and when it leaves, not whether a job was theoretically profitable.
There are three scenarios you should maintain. A base case using your normal payment patterns. An optimistic case where customers pay on time and you win all quoted work. And a downside case where two or three large invoices slip by 30 days and that kitchen refurb you quoted falls through. The downside case is the one that matters most.
How to build your forecast step by step
You do not need fancy software to start. A Google Sheet or Excel workbook works. Here is the structure that works for a trades business with one to fifteen employees.
Step 1: Set up your columns
Create 13 columns, one per week, starting from next Monday. Label each with the week-commencing date. Add a "Total" column at the end and an "Actual" row for completed weeks.
Step 2: List your cash inflows
Break inflows into categories. Confirmed job payments (jobs booked with agreed payment dates). Estimated job payments (quotes sent but not confirmed, weighted at 50% probability). Retention releases. Any other income like warranty call-out fees or service contract payments.
Step 3: List your cash outflows
Fixed outflows first: wages, PAYE, pension contributions, van leases, insurance premiums, rent, phone contracts, software subscriptions. Then variable outflows: materials for confirmed jobs, subcontractor payments, fuel, tool purchases. Then periodic outflows: VAT quarters, corporation tax or self-assessment payments, annual insurance renewals, CIS deductions.
Step 4: Calculate weekly net cash flow
Subtract total outflows from total inflows for each week. Then calculate a running balance by adding each week's net position to the previous week's closing balance. This running balance is your headline number. If it goes negative in any week, you have a problem coming.
Step 5: Update weekly
Every Friday, replace estimates with actuals for the week just finished. Slide the window forward. Add a new week 13. Adjust any estimates that have changed. This takes 20 to 30 minutes once you have the template set up.
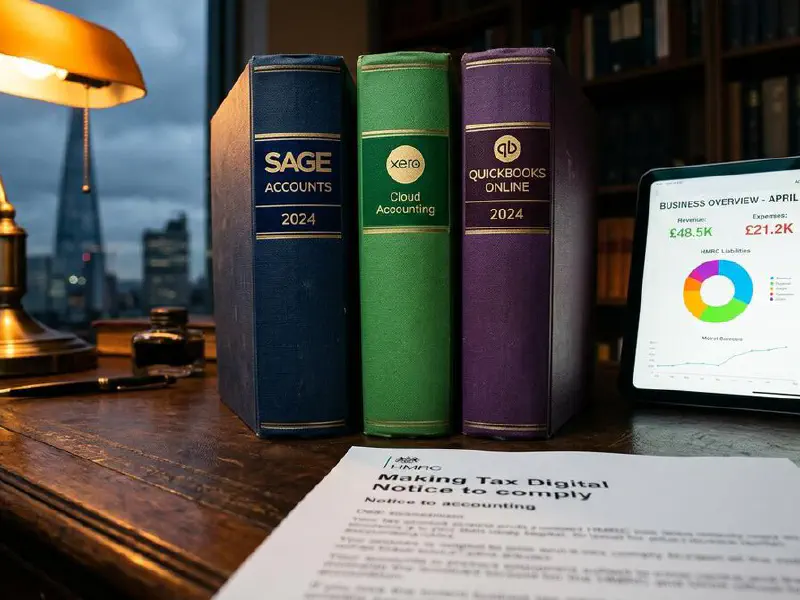
Software that does the heavy lifting

If you already use cloud accounting software, you have a head start. Both Xero and QuickBooks have built-in cash flow forecasting tools that pull data directly from your invoices, bills, and bank feeds. Here is what each offers.
Xero Analytics Plus
Xero's Analytics Plus add-on includes a short-term cash flow projection that looks up to 90 days ahead. It uses AI to predict future transactions based on your historical patterns. You can manually add expected payments and see how different scenarios affect your balance. It is included in the Growing and Comprehensive plans, which start from around £33 per month. For a deeper look at Xero's capabilities compared to alternatives, see our Xero vs QuickBooks vs Sage comparison.
QuickBooks Cash Flow Planner
QuickBooks has a cash flow planner that forecasts up to 90 days based on your outstanding invoices and upcoming bills. It shows projected income, expenses, and your expected balance over time. Available on Simple Start plans and above, starting from around £12 per month for the first six months (then £28 per month). The forecasting is more manual than Xero's AI approach, but it gives a clear visual timeline.
Sage Accounting
Sage offers cash flow insights within its accounting package, though the forecasting is less advanced than Xero or QuickBooks. The standard plan starts from around £14 per month. It covers the basics, invoice tracking, bill management, and bank reconciliation, but you will likely want to export data to a spreadsheet for detailed 90-day forecasting.
Google Sheets or Excel
Free and fully flexible. You build exactly what you need. The trade-off is that nothing is automated. You enter every number manually. For sole traders and small teams, this is often the right starting point before investing in paid software.
Automating your forecast with n8n and Make
Once your forecast lives in a spreadsheet, you can automate the data that feeds it. Tools like n8n and Make.com connect your accounting software, bank feeds, and CRM to your forecast sheet without you writing code.
What you can automate
Pull new invoices from Xero or QuickBooks into your forecast sheet automatically. Flag invoices that are overdue by more than seven days. Send yourself a weekly summary of your projected cash position. Trigger alerts when your projected balance drops below a threshold you set, say £5,000 or whatever your comfort level is.
How it works with n8n
n8n is an open-source workflow automation tool. You can self-host it for free or use their cloud service from £20 per month. A typical cash flow workflow connects your Xero account to Google Sheets, pulling invoice data nightly and updating your forecast columns. The visual workflow builder means you drag and drop rather than code.
How it works with Make.com
Make.com (formerly Integromat) offers a similar approach with a visual builder. The free plan allows 1,000 operations per month, which covers a basic forecast automation. Paid plans start from around £8 per month. The advantage over n8n is that Make requires zero setup; the disadvantage is that you have less control over complex logic.
Neither tool replaces your judgement. They handle the data entry so you can focus on reading the numbers and making decisions.
Seasonal patterns every UK trade should plan for

Cash flow in the trades is not linear. It follows patterns that repeat year after year, and your forecast needs to account for them.
January to March: Typically the quietest period for new project starts. Customers are recovering from Christmas spending. VAT and self-assessment payments fall in January. Many trades see a 20-30% dip in new enquiries. Emergency call-outs (burst pipes, boiler breakdowns) partly offset this for plumbing and heating trades.
April to June: Work picks up as the weather improves. Garden projects, extensions, and renovation work starts. This is when your pricing model matters most, because the jobs you quote now will determine cash flow through summer.
July to September: Peak season for most outdoor trades. Cash flow is usually strongest here. The risk is overcommitting, taking on more work than you can deliver, which pushes payment collection into the quieter autumn months.
October to December: A second push as customers try to complete work before Christmas. November and December see a sharp drop-off in new enquiries. Material costs sometimes spike due to supply chain pressure before the holiday shutdown.
Your 90-day forecast should include a seasonal adjustment. In January, weight your downside scenario more heavily. In July, resist the temptation to assume every quote will convert. History is the best guide. After 12 months of running your forecast, you will have your own data to work from.
Late payments and how to forecast around them

The single biggest mistake in cash flow forecasting is assuming customers will pay on time. They will not. Direct Line's 2024 research found 81% of tradespeople are currently owed money, with 42% chasing more late payments than the previous year. The mental health impact is real too: 32% report anxiety and 22% report stress from chasing overdue invoices.
Build late payment assumptions into your forecast from day one. If your payment terms are 14 days, assume domestic customers pay in 21-28 days. If you work for commercial clients or main contractors, assume 45-60 days regardless of what the contract says. Construction has the longest average payment delay of any sector at 38.2 days.
The UK government is finally acting on this. The July 2025 consultation proposed a hard 60-day maximum payment term between businesses, with a glide path to 45 days within five years. A full ban on retention payments under construction contracts is also on the table, along with mandatory statutory interest at Bank Rate plus 8% on late payments. These reforms will help, but they are not in force yet. For now, forecast based on reality, not terms.
Practical steps to protect your cash flow
Take deposits. A 30-50% deposit on materials before starting work is standard practice and protects you from the timing gap. Stage payments on larger jobs, 30% at start, 35% at first fix, 35% at completion. Invoice on the day you finish, not the following Monday. And follow up on day eight, not day thirty.
Factor compliance costs into your forecast too. Building Safety Act compliance and MTD Phase 2 requirements both create cash flow obligations that need forecasting alongside your normal business expenses.
Common forecasting mistakes that cost you money
After working with dozens of trades businesses on their finances, I see the same mistakes repeatedly.
Mistake 1: Counting quoted work as confirmed income. A quote is not an order. Until the customer has signed and you have a start date, treat it as speculative. Weight it at 30-50% probability in your forecast, not 100%.
Mistake 2: Forgetting periodic payments. VAT quarters, annual insurance renewals, vehicle MOTs and services, professional body memberships. These hit hard when you have not planned for them. List every periodic payment at the start of the year and slot them into the right weeks.
Mistake 3: Not updating weekly. A forecast you built in January and never updated is useless by March. The value comes from the weekly habit of reviewing and adjusting. Twenty minutes every Friday will save you thousands.
Mistake 4: Only running one scenario. Your base case is the middle ground. You also need a downside case. What happens if your two biggest invoices both pay 30 days late? What happens if a major job gets postponed? If the downside case still shows a positive balance, you are in good shape. If it shows negative, you need a contingency plan now, not when it happens.
Mistake 5: Mixing up profit and cash. You can make a profit on every job and still run out of cash. The 30-day gap between spending on materials and collecting payment is where this disconnect lives. Your P&L says one thing. Your bank balance says another. The forecast tracks the bank balance, which is the one that matters for survival.
For a more detailed look at keeping your numbers straight, see our guide to preparing monthly management accounts.
What tradespeople are saying
Recommended videos

Create a Cash Flow Forecast for Your Business (FREE TEMPLATE)
Step-by-step Google Sheets tutorial

Master Cash Flow Management for Your Construction Business
Construction-specific cash flow guide

Short-term cash flow in Analytics Plus
Xero

Cashflow Management Explained for Small Business UK
UK-focused cashflow explainer

Scenario Planning for Small Business Survival 2025
Cash flow forecasting walkthrough

Cash Flow Management for Construction Companies
Construction-specific strategies

Keep Your Contractor Business Cash Flow Flowing
Expert contractor tips

4 Secrets to Increasing Cash Flow on Construction Projects
Construction project finance tips
Frequently asked questions
About two to three hours for the initial setup if you are building it in a spreadsheet from scratch. After that, the weekly update takes 20 to 30 minutes. The first month is the hardest because you are gathering your baseline data. It gets faster every week.
No. A Google Sheet works perfectly well. Accounting software like Xero or QuickBooks makes it easier because it pulls data automatically, but the spreadsheet approach gives you more control and costs nothing. Start with a spreadsheet. Move to software when the manual entry becomes a bottleneck.
The forecast is simpler because you have fewer outflows, but it is just as important. Sole traders are more exposed to cash flow shocks because there is no buffer. A single late-paying customer can wipe out your working capital for the month.
Weeks one to four will be 80-90% accurate because they are based on confirmed jobs and known expenses. Weeks five to nine will be 60-70% accurate. Weeks ten to thirteen are more speculative, maybe 40-50%. That is fine. The point is not precision. The point is spotting trends early enough to act.
Yes. Your forecast tracks actual cash movements. VAT comes in with customer payments and goes out when you pay your VAT return. Include both. Many trades businesses get caught out by VAT quarters because they treat collected VAT as their own money. It is not. Your forecast should show exactly when that VAT payment is due.
That is exactly why you run the forecast. You have options: chase outstanding invoices early, delay non-essential purchases, take deposits on new jobs, arrange an overdraft facility with your bank, or bring forward payment milestones on large projects. The earlier you see it, the more options you have.
My verdict
I have seen businesses with turnover in the hundreds of thousands collapse because nobody was looking three months ahead. And I have seen sole traders with modest revenue survive tough winters because they spotted the crunch coming and adjusted. The difference is not money. It is visibility. A 90-day rolling forecast gives you that visibility for the cost of 30 minutes a week. If you are running a trades business without one, you are flying blind. Start this Friday. The first version does not need to be perfect. It just needs to exist.
Ready to Transform Your Business?
Turn every engineer into your best engineer and solve recruitment bottlenecks
Join the TrainAR Waitlist