
Quick Answer
Our free Google Sheets monthly business financial tracker logs every invoice you raise and every cost you pay, then pivots the data into a one-screen dashboard showing revenue, expenses, gross profit, net profit, and margin for each month. It works for sole traders, limited companies, and CIS subcontractors, and the structure lines up with what Making Tax Digital for Income Tax expects from April 2026. Open the link, click File > Make a copy, and you can be logging transactions in under two minutes.
Table of Contents
- Download the template
- Why a monthly tracker matters more than most trades realise
- What is inside the spreadsheet
- The pivot table dashboard, explained
- First-time setup, 7 steps
- Income and expense categories we pre-built
- How this template handles Making Tax Digital
- Using AI to auto-categorise lines and chase late invoices
- When to switch from a spreadsheet to proper software
- What tradespeople are saying
- Recommended videos
- Frequently asked questions
- My verdict
 Google Sheets
Download the template
The tracker is a Google Sheets file. You do not need to sign up for anything, hand over an email address, or install software. Open the link, click File, then Make a copy, and you have your own private version in your Google Drive that nobody else can see.
Get the template
Open the free TrainAR Monthly Financial Tracker in Google Sheets, then choose File > Make a copy. Rename it to {Your Business} - Financial Tracker 2026, drag it into a folder called Accounts, and pin the tab in your browser. That single pinned tab is going to be the most useful piece of admin you do this year.

If you prefer Excel, click File > Download > Microsoft Excel (.xlsx) once you have made your copy. The pivot table dashboard works the same way in Excel, though the look is slightly different. We test the template in both Google Sheets and Excel for Microsoft 365 every quarter.
One more thing before you start logging numbers. If you also need to handle the front end of the job, our free ServiceM8 quote template and VAT-ready invoice template pair with this tracker. Quote, invoice, then log the result here. That is the whole admin loop in three tools, all free.
Why a monthly tracker matters more than most trades realise
Most trades businesses I speak to look at their numbers once a year, when their accountant calls about the tax return. That is not financial management. That is a post-mortem. By the time you see the figures, you cannot do anything about them.
The numbers tell the story. 65 percent of failed UK SMEs cite cash flow as the cause of death, and the average small business is dealing with cash flow issues ten times a year. The average SME is sitting on £22,000 of late invoices at any given moment. None of that gets fixed by hoping. It gets fixed by looking at your revenue and your costs at the end of every month and asking three honest questions.
- Did I make money this month? Revenue minus costs. Plus or minus a number. If it is negative two months in a row, something needs to change.
- Where did the money actually go? Materials, vehicle, subcontractors, marketing, the lot. You cannot cut costs you cannot see.
- What is the bank balance going to look like in 60 days? Based on jobs invoiced, expected payment dates, and known costs. This is the one that prevents the late-night panic.
A monthly tracker answers all three questions in about ten minutes. That is the entire pitch.
This is not a substitute for an accountant
This template is for managing your business day to day, spotting problems early, and arriving at your accountant’s office with clean numbers instead of a shoebox. It is not a tax return. You still need a qualified accountant or a proper bookkeeping product to submit MTD updates, file your Self Assessment, and sign off your year-end accounts. The cleaner the data you feed them, the less they have to charge you.
What is inside the spreadsheet
The template is one Google Sheets file with five tabs. Each tab does one job. The whole thing is colour-coded so you know which cells you type into (white) and which calculate themselves (light grey, do not touch).

1. Income log
Date, invoice number, customer, job description, category, net amount, VAT, gross, payment status, and date paid. Each line is one invoice. If you raise 200 invoices a year, you end up with 200 rows.
2. Expense log
Date, supplier, description, category, net, VAT, gross, payment method, and a column for the receipt link (Google Drive URL or a Dext reference). Mirror image of the income log.
3. Dashboard
The pivot table. Monthly columns, totals by category, gross and net profit, profit margin, and a year-to-date column. Updates automatically when you add lines to the two logs.
4. Cash forecast
A 90-day rolling view. Pulls unpaid invoices from the income log, adds expected costs from the expense log, and shows your projected bank balance week by week.
5. Settings
VAT scheme (standard, flat rate, or not registered), VAT rate, business type (sole trader, limited, CIS subcontractor), categories list, and your opening bank balance for the year.
The pivot, prebuilt
You do not need to know how pivot tables work. We have built it for you. Once you start adding lines to the income and expense logs, the dashboard fills itself in. If you ever break it (we all break formulas occasionally), there is a reset button in the Settings tab.
The pivot table dashboard, explained
The pivot table is the one piece of spreadsheet magic that turns this from a glorified diary into a proper management tool. Here is how it works in plain English.
You log every invoice on the Income tab. You log every cost on the Expense tab. The pivot table on the Dashboard reads both tabs and groups everything by month and by category. So at the end of May, you can see at a glance that you billed £14,200, you spent £3,100 on materials, you paid £1,840 in fuel, your subcontractors took £2,600, and your net profit was £4,820. That is a 33.9 percent margin, which is on the right side of the line.

If you compare May to April side by side, you might see materials spend doubled. That should prompt a question. Did you do a bigger job, or are you overspending on supplies? Either is fine if you know about it. The trouble starts when you do not.
The dashboard also gives you a year-to-date column. By month nine, you can see whether you are on track to hit your annual turnover and profit targets. If you are not, you still have three months to do something about it. That is the difference between management and post-mortem.
| Dashboard row | What it shows | Why it matters |
|---|---|---|
| Revenue (net) | Total invoiced before VAT, by month | Your real income. VAT is not yours, it belongs to HMRC. |
| Direct costs | Materials, subcontractors, plant hire, job-specific costs | Costs that disappear if the job did not happen. |
| Gross profit | Revenue minus direct costs | How much each job actually contributes. |
| Overheads | Vehicle, insurance, software, marketing, office | Costs you pay even when the van is parked. |
| Net profit | Gross profit minus overheads | The actual money you made this month. |
| Net margin % | Net profit divided by revenue | Trades benchmark: 15-25 percent is healthy. |
| Cash collected | Invoices paid this month (not raised) | Profit is theory. Cash collected pays your mortgage. |
Two numbers usually surprise people the first time they see them properly. The first is the gap between revenue and cash collected. You can have a great revenue month and still be skint because nobody has paid yet. The second is overheads. Most trades businesses I have worked with under-count overheads by 30 to 40 percent, mostly because the van, the phone, the software, and the insurance are paid by direct debit and just feel like background noise.
First-time setup, 7 steps
Allow 20 minutes. Less if you have your last year of bank statements already sitting in a folder.
- Make a copy. Open the template link, File > Make a copy, rename it, save it to your Google Drive in an Accounts folder.
- Fill in the Settings tab. Business name, VAT scheme, VAT rate, year start, opening bank balance. Takes 2 minutes.
- Review the category lists. We have pre-loaded the common ones (Materials, Fuel, Subcontractors, Plant Hire, Insurance, Software, Marketing, Office, Phone, Bank Fees, Other). Add or rename to suit your business.
- Backfill the current month. Log every invoice raised since the 1st on the Income tab. Log every business cost on the Expense tab. Use your bank statement as the prompt list.
- Check the dashboard. Click the Dashboard tab. The current month column should be populated. If something looks off, click the pivot table and choose Refresh from the right-hand panel.
- Set up a weekly habit. Friday afternoon, 20 minutes, log the week’s transactions. Make it the same time every week or it will not happen.
- Pin the tab. Right-click the browser tab in Chrome and choose Pin. It will sit at the front of your tabs forever, which means you will actually open it.
If you are mid-year
Do not try to backfill the whole year on day one. You will give up. Backfill the current month only, then add a row for each previous month with a single “Prior month total” line on the Income and Expense tabs, pulled from your accountant’s figures or your accounting software. From this month forward, log every line. By the end of the financial year you will have proper month-by-month data.
Income and expense categories we pre-built
The categories matter because they drive the pivot table breakdown. We chose them to map cleanly to a trades P&L and to the HMRC self-employment categories you will see on your tax return. That means when your accountant exports your data at year-end, the categories already match.

Income categories
Most trades businesses can get away with three or four. We default to:
- Domestic labour – private customers, your normal residential work.
- Domestic materials – materials charged back to the customer at cost or with a markup.
- Commercial – trade customers, contractor work, B2B jobs.
- Maintenance contracts – recurring monthly or annual service agreements. Worth tracking separately because it is the most stable income most trades have.
- Insurance / warranty work – jobs paid by an insurer or warranty provider. Tracked separately because the payment timing is brutal (often 90 days plus).
Expense categories
These match the HMRC Helpsheet 222 structure for the self-employment pages of your Self Assessment:
| Category | What goes in | HMRC SA box |
|---|---|---|
| Cost of goods (materials) | Materials, parts, consumables for jobs | Box 17 |
| Subcontractor costs | Self-employed help, CIS subcontractors | Box 18 |
| Vehicle costs | Fuel, servicing, MOT, road tax, repairs | Box 20 |
| Plant and equipment hire | Hired tools, access equipment, scaffolding | Box 21 |
| Premises costs | Rent, rates, light, heat, insurance on premises | Box 23 |
| Software and IT | FSM software, accounting, Microsoft 365, AI tools | Box 27 |
| Advertising and marketing | Website, Google Local Service Ads, vehicle livery, leaflets | Box 27 |
| Bank, finance, insurance | Bank charges, interest on business loans, public liability | Box 25 / 24 |
| Phone and communications | Mobile, internet, VoIP, business landline | Box 27 |
| Training and CPD | Gas Safe registration, Part P, NICEIC, courses | Box 27 |
Stick to these unless you have a really good reason to add more. Every extra category is one more decision per receipt, and the whole point is that logging is fast.
How this template handles Making Tax Digital
From 6 April 2026, sole traders earning over £50,000 must keep digital records and submit quarterly updates to HMRC through Making Tax Digital for Income Tax. The threshold drops to £30,000 from April 2027 and £20,000 from April 2028. Most full-time trades businesses are inside that net.
This spreadsheet is not MTD-compliant on its own. HMRC will not accept a spreadsheet submission directly. What it does do is hold your data in the structure that MTD bridging software expects, so you can either copy-paste the quarterly totals into your accountant’s submission, or export the data into bridging software like 123Sheets, Sage, FreeAgent, or Xero. We have a full MTD Phase 2 automation playbook that walks through the bridging options for trades.
The first MTD deadline
If your income is over £50,000, your first quarterly update covers 6 April to 5 July 2026 and must be filed by 7 August 2026. Miss it and HMRC adds a penalty point. Four points and you get a £200 fine, then £200 for every late submission after that. The tracker tabs are aligned to the MTD quarters so you can hand the totals over without any reshuffling.
If you want a tracker built specifically around MTD Phase 2 quarterly structure with the bridging-software export ready to go, grab our MTD Phase 2 record-keeping pack. It is the bigger sibling of this one.
Using AI to auto-categorise lines and chase late invoices
The boring part of any tracker is typing in transactions and chasing customers who have not paid. Both of those are now jobs you can hand to an AI.
Two workflows are doing the heavy lifting for the trades I work with in 2026:
- Export the month’s bank statement as CSV
- Paste into ChatGPT (GPT-5) or Claude (Sonnet 4.6) with the category list
- AI returns a categorised table you paste straight into the Expense tab
- Spot-check 10 rows, then trust it
- Make.com or n8n reads the Income tab nightly
- Any invoice 14, 21, or 28 days overdue triggers a polite reminder
- Email or WhatsApp message sent automatically
- Marks the customer as “chased” in a hidden column
The first one alone saves most sole traders an hour a month and removes 90 percent of the typing errors. The second turns £22,000 of average late invoices into something closer to £8,000, based on what we see when clients switch it on.
Job profitability, while you are at it
If you want the tracker to also tell you which jobs make you money and which lose you money, add a Job column to both the Income and Expense logs. The pivot table can then group by job instead of by month. Our job profitability analysis guide walks through the full method, including the labour-tracking bit most trades skip.
When to switch from a spreadsheet to proper software
I am going to be honest with you. This tracker is brilliant up to a point. That point is usually one of three things:
- You hit the VAT threshold. Once you are VAT-registered (£90,000 turnover in 2026), the volume of transactions usually makes manual logging painful. Xero, QuickBooks, or FreeAgent will save you serious time.
- You take on your first employee. Payroll on a spreadsheet is a recipe for HMRC trouble. Get proper payroll software, and at that point the bookkeeping might as well live in the same place.
- You move to MTD quarterly submissions. If you are above the £50,000 threshold, bridging software plus a spreadsheet works for a year, but most trades I know find it easier to just move to a full accounting product and let it submit directly.
Until you hit one of those triggers, a well-kept spreadsheet beats a half-used £30-a-month accounting product. Most trades pay for software and then never log in. A spreadsheet they have to open shows them what is happening.
For the deeper dive on cash flow once you outgrow this tracker, our 90-day cash flow forecasting guide covers the rolling forecast method that the trades businesses I have worked with use to spot trouble eight weeks before it lands. And if you want a fancier dashboard that pulls live data out of Xero, our Xero auto-import dashboard is the next step up.
What tradespeople are saying
I went looking for what real UK trades and sole traders actually say about spreadsheet-based bookkeeping, on the forums where they talk to each other rather than to vendors. Mixed views, mostly positive, with a consistent warning about checking with your accountant on format.
The common thread on every forum I read: start with a spreadsheet, get the discipline in place, then move to software when transaction volume justifies the monthly fee. Almost nobody recommends the reverse path. Buy software first, fail to log in, then go back to a spreadsheet.
Recommended videos
Six short tutorials I found genuinely useful when I was setting up the original version of this tracker. None of them are UK-specific (most P&L spreadsheet content is American), but the mechanics are identical.

P&L Statement in Google Sheets in Under 15 Minutes
Spreadsheet Class · 14 min walkthrough with free template
Build a Professional P&L Statement in Google Sheets
Stewart Gauld · 20 min build, monthly and quarterly views

Bookkeeping for Small Business using Google Sheets
Pursuit of Passive Income · income/expense template walkthrough
Easy Spreadsheet for Tracking Business Income and Expenses
Sherrie Suski · income statement structure explained

Income Statement Template in Google Sheets
Edspira · the accounting theory behind the numbers
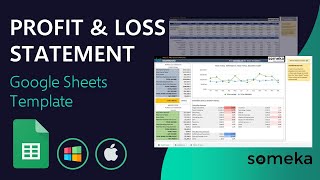
Profit and Loss Statement Google Sheets Template
Smart Office · pre-built template tour and customisation
Frequently asked questions
Genuinely free. No email signup, no upsell, no watermark. We build these because they help UK trades, and because tradespeople who learn to manage their numbers become the customers we want for our software in the long run. The catch, if there is one, is that we hope you read the rest of the academy.
Yes. Switch the business type in the Settings tab to Limited. The category list adjusts to include directors’ dividends and corporation tax provisions. The pivot table works the same way. For a proper limited company, you still need an accountant to file the year-end accounts and CT600 with Companies House and HMRC.
Yes. On the Income tab there is a CIS column. If you tick it on a line, the spreadsheet treats 20 percent (or 30 percent for unregistered subcontractors, or 0 percent for gross payment status) as deducted at source and shows your gross and net figures separately. Helpful for reconciling against your monthly CIS300 statement. The full picture is in our CIS guide.
Set the VAT scheme to Flat Rate in Settings and enter your flat rate percentage. The dashboard will calculate the flat rate liability automatically and show you the gap between what you charge customers and what you pay HMRC, which is your flat-rate “profit” or loss. If you are not sure whether Flat Rate is right for you, our Flat Rate vs Standard VAT calculator has the decision framework.
Weekly. Twenty minutes on a Friday afternoon, ideally before the pub. If you let it slide, you will end up with a six-month backlog of receipts and you will hate the spreadsheet. The whole thing falls apart if you are not consistent.
Not directly. From April 2026 HMRC require quarterly updates to be sent through MTD-compatible software. A spreadsheet plus “bridging software” is allowed, where the bridging tool reads your spreadsheet and submits to HMRC. Bridging software costs from about £15 a year. For most trades, a full accounting product (Xero, FreeAgent, QuickBooks) is easier than the bridging route once you are at MTD scale.
Yes. Click Share top right, type your accountant’s email, give them Viewer access (not Editor) so they cannot accidentally change anything, and they can pull the data they need at year-end without you having to email screenshots. Most accountants prefer this to a PDF export because they can sort and filter.
Make a copy of the template again, rename it 2027 Financial Tracker, copy your unpaid invoices and unsettled supplier bills over as the opening position, and start fresh. Keep the previous year’s file untouched as the permanent record. HMRC require you to keep self-employment records for five years after the 31 January submission deadline.
My verdict
The cheapest piece of business software you will ever use
Most trades businesses I work with end up either flying blind with their numbers, or paying for accounting software they barely log into. This tracker sits in the middle. It costs nothing, it takes 20 minutes a week, and it puts the three numbers that matter (revenue, profit, cash) on one screen. Use it for a year, get the discipline in place, and by the time you outgrow it you will be the kind of business owner who actually knows what they want from proper software. That is the order to do this in.