
Quick Answer
This free Google Sheets template gives you a single-page financial dashboard for your trades business. It tracks monthly revenue, expenses, profit margin, VAT liability and cash flow forecast across 12 months. You can fill it in manually or connect it to Xero via n8n so the numbers update themselves. No accounting degree required.
Table of Contents
What this template does
Most trades business owners know their numbers are important. Far fewer actually look at them every month. This template is built to close that gap. It is a Google Sheets workbook with five tabs that track the financial health of a plumbing, electrical, building or any other trades business across a full year.
The dashboard tab pulls data from the other four tabs and displays your revenue, expenses, gross profit margin, net profit, VAT liability and a rolling 3-month cash flow forecast. All the formulas are pre-built. You just enter the numbers, or connect Xero and let n8n do it for you.
It is not a replacement for Xero, QuickBooks or Sage. It sits alongside your accounting software and gives you the management view that those tools bury three clicks deep. Think of it as the cockpit instruments for your business. Xero is the engine, this spreadsheet is the dashboard on the wall.
Sole traders, partnerships and small limited companies in the trades. If you run a team of 1 to 15 and want a clearer picture of where your money goes each month, this template is for you. It works whether you use Xero, enter data manually, or export CSV files from your bank.
Dashboard walkthrough: the five tabs
Tab 1: Revenue. Log every invoice or payment received. Columns for date, client name, job reference, amount (ex-VAT), VAT amount and total. If you connect Xero, invoices populate here automatically. There is a monthly subtotal row at the bottom that feeds the dashboard.
Tab 2: Expenses. Every cost your business incurs: materials, fuel, tools, insurance, subcontractor payments, vehicle costs, phone bills. Each row has a category dropdown so the dashboard can break expenses down by type. Categories are pre-set for trades businesses but fully editable.
Tab 3: Profit and Loss. A monthly P&L that calculates itself from the Revenue and Expenses tabs. Shows gross revenue, cost of goods sold (materials and subcontractors), gross profit, overheads, and net profit. The gross margin and net margin percentages update automatically.
Tab 4: Cash Flow Forecast. A 12-month rolling forecast. Enter expected income and committed expenses for future months. The template calculates your projected bank balance at the end of each month. Colour-coded cells warn you when projected cash drops below a threshold you set.
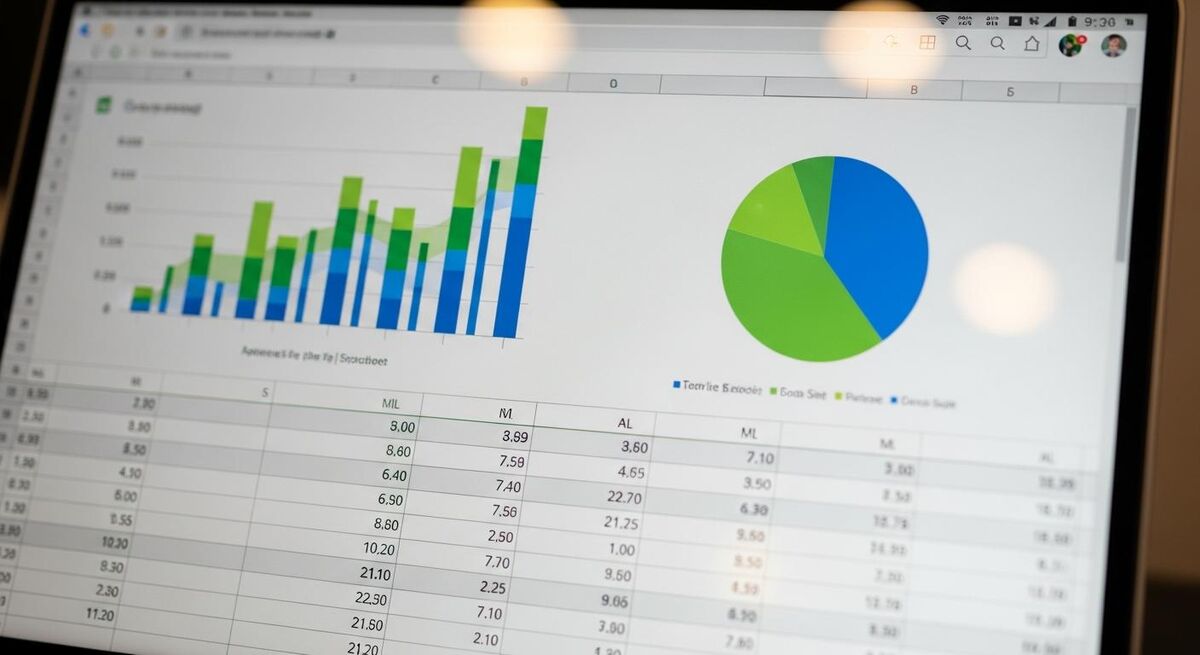
Tab 5: Dashboard. The summary page. Charts for monthly revenue vs expenses, profit margin trend, expense breakdown by category, and a cash position gauge. All data pulls from the other four tabs. You do not enter anything here directly.
Even without the Xero connection, this template works as a standalone manual tracker. Download the Google Sheet, make a copy to your Drive, and start entering numbers. The formulas and charts work the same either way.
How the Xero auto-import works
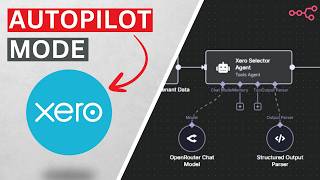
The optional automation layer uses n8n, an open-source workflow automation tool. The workflow connects to your Xero account, pulls new invoices and bank transactions, and writes them into the Revenue and Expenses tabs of the Google Sheet. It runs on a schedule you choose, daily or weekly.
n8n is free to self-host with unlimited executions. If you prefer a hosted option, the Starter plan costs around €24 per month. Either way, once the workflow is set up it runs in the background. Your dashboard updates itself without you lifting a finger.
The n8n workflow handles three things. First, it pulls paid invoices from Xero and writes them to the Revenue tab. Second, it pulls categorised expenses and writes them to the Expenses tab. Third, it stamps each row with a sync timestamp so you can see when data last updated. Duplicate detection is built in, so running the sync twice does not create double entries.
You will need a Xero account on any plan (Starter at £29/month + VAT is enough) and either a self-hosted n8n instance or an n8n Cloud account. The setup takes about 30 minutes if you follow the guide below.
Google Sheets: free. Xero Starter: £29/month + VAT. n8n self-hosted: free (runs on a £3-5/month VPS). Total cost for the auto-updating version: £29/month + VAT for Xero alone if you self-host n8n. The spreadsheet template itself costs nothing.
Setting it up step by step
Step 1: Copy the template. Open the Google Sheets link, click File > Make a copy. Save it to your Google Drive. Rename it with your business name.
Step 2: Set your business details. On the Dashboard tab, fill in your business name, VAT registration number (if applicable), financial year start month, and your minimum cash threshold for the forecast warning.
Step 3: Customise expense categories. Go to the Expenses tab and edit the dropdown list to match your actual cost categories. The defaults cover most trades businesses: materials, fuel, tools, insurance, vehicle, subcontractors, phone, software, training, and miscellaneous.
Step 4 (optional): Connect Xero via n8n. If you want automatic data import, follow the n8n setup guide. You will need to create a Xero app in the Xero Developer Portal, generate OAuth2 credentials, and paste them into the n8n workflow. The workflow template is included with the download.
Step 5: Enter historic data. For the dashboard to be useful from day one, enter at least 3 months of past revenue and expenses. If you use Xero, the n8n sync can pull historic invoices. If not, your bank statements will have what you need.
Step 6: Review monthly. Set a calendar reminder for the first working day of each month. Spend 15 minutes reviewing the dashboard. Check your profit margin, look at the expense breakdown, and verify the cash flow forecast for the next 3 months.
This template tracks VAT collected and paid as separate line items. It is not a VAT return tool. You still need Xero or equivalent MTD-compatible software for your actual HMRC submissions. If you are a CIS contractor or subcontractor, make sure your expense categories include a CIS deductions line so your P&L reflects net payments accurately. Our CIS guide covers the detail.
Making it your own
Add a job-level tracker. If you want to see profit per job rather than just monthly totals, duplicate the Revenue tab and add columns for estimated cost, actual cost, and job margin. Link these to the Dashboard tab with a SUMIF formula grouped by month.
Change the chart colours. The dashboard charts use TrainAR brand colours by default. Click any chart, go to Customise, and pick colours that match your own branding. Small thing, but it makes the spreadsheet feel like yours.
Add a wage tracker. For businesses with employees, add a sixth tab for payroll costs. Include columns for employee name, gross pay, employer NI, pension contribution, and total cost. Link the monthly totals to the Expenses tab under a "wages" category.
If you use our job estimate spreadsheet template, you can cross-reference quoted margins against actual margins from this dashboard. Comparing the two month-on-month tells you whether your estimates are accurate or whether you are consistently under-pricing.
The template is unlocked with no password protection. Every formula is visible and editable. If you break something, just re-download a fresh copy.
What tradespeople are saying
Recommended videos

CFO Dashboard in Google Sheets: Automated Xero Reporting
Coefficient
How to Connect Xero to Google Sheets or Excel
Coupler.io
Ultimate Google Sheets Accounting Template (2025 Edition)
Money Instructor
Automated Xero Invoice Processing with OpenAI + n8n
Auto AI Studio
Fully Automated Xero Multi-Client Bookkeeping in n8n
Automations Era

How I Built a Chat Bot Accountant for Xero with n8n
Automations Era
Frequently asked questions
No. The template works as a standalone Google Sheet. You can enter revenue and expenses manually from your bank statements. The Xero connection is optional, it just saves you the data entry.
The manual version works with any accounting software because you are just typing numbers in. The automation workflow is built for Xero specifically. n8n does have QuickBooks and Sage nodes, so it is possible to adapt the workflow, but you would need to rebuild the connection steps yourself. Our Xero vs QuickBooks vs Sage comparison can help you decide which platform suits your business.
No. This is a management dashboard, not a tax compliance tool. You still need MTD-compatible software like Xero for your quarterly HMRC submissions. This template helps you understand your numbers between submissions. Our MTD Phase 2 penalties guide explains what you need to stay compliant.
About 30 minutes. The longest part is creating the OAuth2 app in the Xero Developer Portal. Once the credentials are in n8n, the workflow itself takes 5 minutes to configure. After that, it runs on autopilot.
Yes. The Revenue tab separates amounts ex-VAT and VAT charged. The Dashboard tab shows your estimated VAT liability for the current quarter. But remember, the actual VAT return must still go through MTD-compatible software.
Absolutely. Share the Google Sheet with your accountant and give them view or edit access. Some accountants appreciate having a dashboard like this because it gives them context before they dive into the raw Xero data. It also saves you money because they spend less time figuring out what happened each month.
My verdict
I have seen too many trades business owners who know their annual turnover but cannot tell you their profit margin last month. This template does not replace your accountant or your accounting software. It gives you the numbers that matter, in one place, updated regularly. The Xero auto-import is a bonus. Even the manual version, updated once a month for 15 minutes, will give you more financial clarity than most sole traders have ever had. Download it, fill in three months of data, and look at the charts. If the numbers surprise you, that is exactly why you needed it.