

Quick Answer
Most trades businesses know their overall margin. They do not know which jobs delivered it. Track four cost categories on every job: labour (paid and unpaid), materials, travel, and a share of overhead. Compare actual against quoted. Tag every job by type, customer, and source. After 90 days you will see which jobs make you money, which break even, and which quietly lose it. Then you fire the worst-performing job types. Software like Fergus, Commusoft, BigChange, and Xero Projects does the tracking. AI does the pattern detection. Spreadsheets only work if you actually use them.
Table of Contents
- Why most trades businesses don't know which jobs make money
- The four cost categories you must track
- Setting up job-level tracking in your business
- Job costing software compared: Fergus, Commusoft, BigChange, Xero
- Where AI changes the analysis
- Reading the data and spotting the patterns
- Acting on the data: firing your worst job types
- What tradespeople are saying
- Recommended videos
- Frequently asked questions
- My verdict
Why most trades businesses don't know which jobs make money

Ask most trades business owners how their business is doing and they will tell you the year-end figure. Revenue went up, profit was decent, the accountant looked pleased. Ask them which of last year's 200 jobs made the most money, and which lost them money, and the answer goes quiet.
That gap is the problem. Year-end accounts roll every job into a single number. By the time you see it, the damage is done and you cannot trace it back. The average UK construction firm runs on a net margin of 2 to 4 percent. With margins that thin, a single unprofitable job type repeated across the year can flip you from profit to loss without you knowing it happened.
The trades businesses that grow past five engineers usually figure this out the hard way. They take on a contract that feels busy, the diary fills, revenue climbs, and at year-end the bank balance is somehow smaller than the year before. Then they sit down with the records and discover that the boiler service plan they thought was a steady earner was actually losing them ninety pounds per visit once travel and unpaid admin time were counted properly.
Job-level tracking is not new. Builders' merchants have been pricing materials per job for a hundred years. What is new is the ability to do it automatically, in real time, without anyone having to type costs into a spreadsheet at the end of the week.
The four cost categories you must track
Job costing falls apart when you only track the easy stuff. Most owners log materials because the supplier sends an invoice. They log labour because their lads fill in timesheets. They miss travel and overhead, and that is where the margin disappears.
The four categories below are the minimum. Track all of them on every job, or do not bother starting.
Labour, paid and unpaid
Labour is the cost of every hour anyone in the business spent on the job. That includes the engineer on site. It also includes the apprentice who collected the parts, the office hour someone spent booking the job in, the half hour you spent on the phone to the customer the night before, and the hour you spent writing up the invoice after.
The unpaid hours are what kill small trades businesses. If you are the owner and you do not charge yourself out at a proper rate for quoting, admin, and customer calls, you will systematically underprice every job in the business. A working rule: anything that would have to be paid for if you were not there should be costed at your standard charge-out rate.
Materials, including waste and warranty
Materials are obvious. The trap is forgetting the bits that did not come from a single supplier invoice. A boiler install is not just the boiler. It is the flue extensions, the magnetic filter, the gas pipework, the consumables out of the van, and the half-roll of insulation you did not write down. Most job costing software lets you allocate van stock to jobs as you use it. If yours does not, switch.
Warranty work belongs in the original job, not in a new free callout. If a customer rings two months later with a fault, the labour and materials for that visit reduce the margin on the job you booked it under. Otherwise your boiler installations look healthy until you notice your warranty visits have quietly eaten the profit.

Travel: fuel, time, and vehicle cost
Travel is where firms with broad geographic coverage bleed. A job ninety minutes each way takes three hours of paid labour, twenty-odd pounds of diesel at current prices, and a slice of vehicle running cost that most businesses never allocate to anything. If you are not pricing that into the quote, the customer two villages away is being subsidised by your local jobs.
The simple version: track miles per job, multiply by an all-in rate that includes fuel, vehicle finance, insurance, MOT, and depreciation. HMRC's approved mileage rate of 45p per mile for the first 10,000 business miles is a starting point, but most van fleets cost more than that when you do the maths honestly. Vehicle telematics platforms can log this automatically.
Overhead allocation
Overhead is the rent, the office hour, the accountant, the insurance, the merchant card fees, the CRM subscription, the diesel for the van even when it is parked, and the £200 a month your phone bill comes to. None of it belongs to a specific job, all of it has to be recovered from somewhere.
The standard approach: take your total annual overhead, divide by your billable engineering hours for the year, and add that hourly figure to every job's labour cost. A two-engineer firm with £40,000 of overhead and 3,000 billable hours has a £13.33 per hour overhead burden. Skip that step and every quote you write underprices the work by exactly that amount.
Setting up job-level tracking in your business
The hardest part of job costing is not the maths. It is changing the habits of everyone who touches a job. Engineers stop seeing the timesheet as paperwork and start seeing it as how you know whether to keep doing this kind of work. Office staff stop categorising jobs as "boiler service" or "callout" and start tagging them with job type, customer source, postcode, and quoted versus actual hours.
The setup itself is straightforward, and the order matters.
Step one is to agree the categories. Sit down with whoever runs the office and write a list of every job type the business does. Be specific. "Boiler work" is not a category. "First-time boiler installation, combi to combi swap, system to combi conversion, annual service plan, reactive repair" are five categories. The more granular you go, the more useful the data.
Step two is to agree the customer types. Are you tracking commercial separately from domestic? Repeat customers separately from new? Aggregator leads separately from direct? Each split lets you answer a different question later.
Step three is to set the hourly recovery rate. Most small UK trades businesses need to recover £55 to £85 per chargeable hour to cover labour, overhead, and a target margin. The exact number depends on your overhead and your wage bill. Run it through a spreadsheet before you set the rate in your software.

Step four is to make sure every cost gets to the right job. Set up your accounting software so that supplier invoices can be tagged to a job at the point of entry. Set up your job management software so that labour, mileage, and consumables hit the job in real time. Then make this non-negotiable. If a job has not been costed, it is not finished.
Step five is the weekly review. Once a week, fifteen minutes, look at last week's completed jobs. Quoted price against actual cost, gross margin against target, any jobs where the actual cost overran by more than 10 percent. The point is not to punish anyone. The point is to catch the pattern before it eats six months of profit.
If you are working on the spreadsheet around this and want a structured way to roll it up into your monthly numbers, we have a walkthrough on using Claude Cowork to prepare your monthly management accounts, which is what this kind of job-level data ultimately feeds.
Job costing software compared: Fergus, Commusoft, BigChange, Xero
Four platforms dominate UK trades job costing. They are not interchangeable. Each one is built for a different size of business and a different way of working.
| Software | Starting price (UK) | Best for | Job costing depth |
|---|---|---|---|
| Fergus | From £35 per user per month | Small to mid-size trades, 1 to 15 engineers | Strong, with stock-on-hand and live margin tracking |
| Commusoft | Minimum 4 licences, custom pricing | Mid-size service contractors with SLAs and contracts | Deep, with real-time labour and parts allocation per job |
| BigChange | From £69.95 per vehicle per month (JobWatch) | Fleet-based businesses with vehicle telematics needs | Strong, with telematics-linked travel costing |
| Xero Projects | Included with Standard and Premium plans | Sole traders and small teams already on Xero | Functional, lighter than dedicated job software |
| Tradify | £34 per user per month | Sole traders and small teams up to 5 engineers | Good for quoting and invoicing, lighter on reporting depth |
Fergus
Fergus tracks labour, materials, and expenses against every job and shows true cost and margin as work progresses. The stock-on-hand feature lets you bring parts from the van into the job cost, which closes the gap most other tools leave. Fergus pricing in the UK starts from around £35 per user per month, with a 14-day free trial. The reporting is honest. You can see job-by-job margin without having to run a separate analysis.
The downside is the cost scales linearly with users. A five-engineer business is paying around £175 a month. The software is good. Just make sure you are using the costing features, not just the diary, or you are buying expensive scheduling.
Commusoft
Commusoft is built for service contractors, gas engineers, and businesses with maintenance contracts. The job costing automatically pulls in labour hours from engineer timesheets and parts costs from connected UK wholesalers. Profit reports show total cost, profit, and margin on individual jobs with filters and exports. It is what you want if you run a fleet of engineers on service contracts and need to see which contracts are actually profitable.
It is also the most expensive of the four. Minimum four licences, with monthly cost per user typically in the £100 to £200 range depending on the plan. Below ten engineers it is probably overkill. Above fifteen it starts to make sense.

BigChange
BigChange is the fleet-and-telematics choice. The JobWatch platform starts at £69.95 per vehicle per month and goes up to £99.95 for JobWatch Plus. Because it is built around vehicle tracking, travel costing is more accurate than competitors. You get real mileage per job, real driving time, and real fuel consumption fed into the cost. For businesses where vans are out all day on multiple jobs, that is the right way to do it.
The trade-off is complexity. BigChange has a lot more functionality than most three-engineer firms need. It is built for the 20 to 100 vehicle market.
Xero Projects
Xero Projects is the cheapest entry point because it is included with Xero Standard and Premium plans at no extra cost. Xero plans range from around £15 to £40 per month. It is not as deep as the dedicated job software above, but for a sole trader or a two-person team it is usually enough. You can track labour, materials, and overhead against jobs, run profitability reports, and compare quoted to actual.
The limitation is that Xero is an accounting platform first. The job tracking is functional. The scheduling is not. Most growing trades businesses end up pairing Xero with a job management platform like Tradify or Fergus, with the job platform pushing costs into Xero automatically.
Where AI changes the analysis
Job costing software has been around for twenty years. What is new is the layer of analysis sitting on top of it. Until recently, spotting patterns across hundreds of jobs meant exporting to a spreadsheet and running pivot tables. Most owners did not have the time. So the data sat there.
AI tools change that. You can now point a model at a year of job-level data and ask it three questions that used to be hard to answer.
One: which job types are underperforming. Sort by job type, look at average margin, look at margin variance, and flag anything that consistently runs below your target. Old version: an afternoon in Excel. New version: a prompt and a chart.
Two: which customers are unprofitable. A customer that always books emergency callouts, always wants a discount, and always queries the invoice has a real cost. Tag every job by customer and let the model rank them by lifetime margin.
Three: which lead sources actually deliver profitable work. Most owners know what their leads cost. Few know what those leads deliver in margin. AI can match lead source against final job margin and tell you which channels are worth the spend.
The AI angle gets stronger when it sits inside your job management software. Commusoft's reporting flags engineers whose jobs consistently overrun. Fergus surfaces jobs where actuals beat estimates. The next step, which is already starting to appear, is models that suggest pricing changes for specific job types based on actual margin history.
None of this works if the underlying job data is rubbish. AI on bad data gives you confident wrong answers. Get the tracking clean first.
Reading the data and spotting the patterns

Once you have 60 to 90 days of clean data, you can start spotting patterns. The five questions worth asking every month are the same regardless of the software.
First, what is the gross margin on each job type? Sort the list. Look at the bottom. Anything below your target margin is a candidate for repricing or dropping. If your target is 25 percent and you have a job type running at 8 percent, that is not a small problem.
Second, what is the variance? A job type that averages 30 percent margin but swings between minus 5 and 60 percent is telling you the quoting is inconsistent. A job type that averages 12 percent with a swing of 8 to 16 percent is telling you the work is structurally low-margin. Different problems, different fixes.
Third, which customers are losing you money? Almost every trades business has a few. The signal is usually a combination of discount demands, frequent callbacks, slow payment, and a tendency to book emergency work that bumps planned jobs.
Fourth, which lead sources convert into profitable work? Compare the cost-per-lead against the average margin of jobs from that source. Most owners are surprised. Repeat customers and word-of-mouth typically deliver the highest margin. Aggregator leads with priced-in discounts are often the lowest.
Fifth, are your quoted versus actual hours diverging on specific engineers or specific job types? Consistent overruns are either a quoting problem (you are underestimating the job) or an execution problem (the engineer is slower than the quote allows). Both are fixable. You cannot fix what you cannot see.
Acting on the data: firing your worst job types
Tracking only matters if you act. The temptation is to look at the data, agree it is interesting, and carry on as before. Resist that.
The three actions worth taking once you can see the data are these.
Reprice the work that is close but not enough. A job type running at 12 percent against a 25 percent target is not a kill candidate. It is a repricing candidate. Work out what price would get you to target, write it into next month's quotes, and watch what happens to conversion. You will lose some jobs. The ones you win will pay properly.
Drop the work that is structurally unprofitable. Some job types do not work at any sensible price. Long-distance domestic callouts. Free quotes that take half a day. Bathroom finish work for difficult customers. The cleanest thing is to stop quoting for them. Send a polite "we are not the right fit" message. Most owners find their stress drops along with their revenue, and their margin climbs.

Double down on the work that is profitable. Whatever your top-margin job type is, do more of it. That might mean adjusting marketing to attract more of those leads. It might mean training a second engineer in the specific skill. It might mean adding it as a service for existing customers. The point is that you now know where your money is made, so you go and make more of it.
This is not a one-off exercise. The mix changes. Suppliers raise prices, fuel costs move, labour markets tighten. The job type that was your top earner last year might be your worst this year. Run the analysis quarterly at minimum. Once a month is better.
The businesses that scale past £500,000 a year usually do this. They know their margin per job type to within a couple of percent. They know which customers are worth keeping and which are not. They know which lead sources to feed and which to starve. None of that comes from year-end accounts. All of it comes from job-level data, reviewed honestly, acted on consistently.
If you want to layer this onto a broader financial picture, the 90-day rolling cash flow forecast sits naturally alongside job profitability analysis. One tells you what you are earning per job, the other tells you when the money actually shows up in the bank.
And if you are getting your books ready for the next phase of Making Tax Digital, having clean job-level data already in your accounting software makes the compliance side considerably less painful.
What tradespeople are saying
Recommended videos

How To Analyze Job Profitability
The Profit Constructors

Track job costings and profitability easily in QuickBooks
QuickBooks UK

The #1 metric to track to improve profitability in your business
Business growth channel

Job Costing Reports in QuickBooks Online
QuickBooks

The Secret to Lasting Growth in Your Trades Business
Trades business advisory
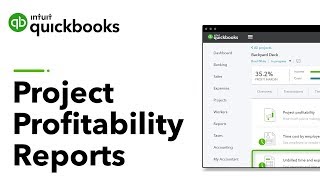
How to Use Project Profitability Reports in QuickBooks
QuickBooks
Frequently asked questions
For a small trades business with the right software, two to three weeks. The first week is agreeing categories, hourly rates, and overhead allocation. The second week is training the team and connecting your accounting. The third week is fixing the things that did not work first time. After 60 to 90 days you have enough clean data to start spotting patterns.
A spreadsheet works if you actually use it. Most owners do not. Job management software costs the same as one cancelled job per month for a small business, and the data is captured automatically by engineers in the field rather than typed up at midnight. Once you go past three engineers, manual tracking falls apart.
It depends on the work and the overhead. Electrical and mechanical trades typically run a gross margin of 25 to 35 percent, with net margins coming back to 5 to 10 percent after overhead. Service plans and maintenance contracts often run higher. One-off domestic installations vary wildly. Pick a target based on what you need to take home, not what your competitors charge.
At your full chargeable rate, the same as you would cost any engineer. If you do not, every quote you write underprices the work. Track the time you spend on each job, including phone calls, site visits, quoting, and invoicing. It is uncomfortable the first time you see how much of your week disappears into unbilled admin. That is the point.
Some of it, yes. Engineers should see whether their jobs are running to estimated hours. That helps them flag jobs going off-track early. Full margin numbers are usually for the owner and office only. The middle ground is to share job-type performance once a quarter so the team understands which work is worth chasing and which is not.
Look at the customer's lifetime value, not just the single job. A repeat domestic customer who books a £2,000 job at break-even but rings you for £800 of paid work twice a year is fine. A commercial customer whose contract loses you money on every visit is not, even if they have been with you for ten years. The test is whether the relationship as a whole is profitable.
My verdict
Year-end profit is a single number that tells you what happened. Job profitability is hundreds of numbers that tell you where. The businesses that grow past five engineers do this. The businesses that stay stuck on the same revenue for five years do not. Pick the software that fits your size, set up the categories properly, review the data every Friday, and once a quarter ask one question: which job types have I been doing that I should stop doing. Then stop doing them. The work that pays is the work you keep.