
Quick Answer
A "satisfactory" EICR only tells you there were no C1, C2 or FI codes on the day. It says nothing about direction of travel. Read the certificate outcome and you learn almost nothing; read the observations and the schedule of test results across your whole stock and you can see deterioration coming a full inspection cycle before it turns into a C2. This guide shows you how to pull the trend out of certificates you are already paying for. Compliance is not assurance, and I will show you the gap between the two.
Table of Contents
- What "satisfactory" actually certifies
- Why a stack of satisfactory EICRs still rots
- What you need before you start
- The method: reading the trend hiding in your EICRs
- Worked example: 4,200 satisfactory EICRs, one hidden trend
- The three deterioration signals teams miss
- Common mistakes reading EICR data
- What duty holders and sparks are saying
- Recommended videos
- Frequently asked questions
- My verdict
Let me start with the uncomfortable bit. Somewhere in your compliance folder right now there is a property with a "satisfactory" EICR that is quietly falling apart, and nobody on your team knows, because the one word on the front page told everyone to stop looking. I spent years sat on my lounge floor going through hundreds of periodic inspections, one constant stream of deja vu, and the thing that got me was never the failures. Failures get actioned. It was the satisfactory reports nobody read past page one.
I ran all the electrical and cyclical services for a UK local authority before I built a business out of this problem. So this is not theory for me. When you are the duty holder for tens of thousands of homes, "satisfactory" is not an answer, it is a full stop that ends a conversation you should be having.

What "satisfactory" actually certifies
An EICR gets one of two outcomes: satisfactory or unsatisfactory. The rule is blunt. Any C1, C2 or FI on the report and it is unsatisfactory. Only C3 observations, or a clean sheet, and it is satisfactory. That is the whole test. Here is what each code means, and more importantly, what each one hides once you scale it across a portfolio.
| Code | What it means | Effect on outcome | What it hides at portfolio scale |
|---|---|---|---|
| C1 | Danger present, immediate risk of injury | Unsatisfactory | Nothing. It screams. It gets fixed. |
| C2 | Potentially dangerous | Unsatisfactory | Little. It triggers 28-day remedials. |
| C3 | Improvement recommended, safe today | Still satisfactory | Everything. This is where the trend lives. |
| FI | Further investigation required | Unsatisfactory | Whether the inspector actually finished the job. |
C3 is the code that matters here, because it is the only observation that records a real problem and still lets the certificate read as a pass. Anything that was acceptable when it was installed but does not meet the current edition of BS 7671 is, at worst, a C3. The installation is safe today. Nobody is legally forced to touch it. And so nobody does.
Why a stack of satisfactory EICRs still rots
Electrical installations do not fail on a schedule to suit your inspection cycle. Insulation degrades. Connections loosen and heat up. Earthing arrangements that were fine in 1985 sit further and further behind the standard with every amendment. None of that shows up as a C1 the moment it starts. It shows up first as a slightly worse test reading, then as a C3, then, one cycle later, as a C2 that lands on your desk with a 28-day clock attached.
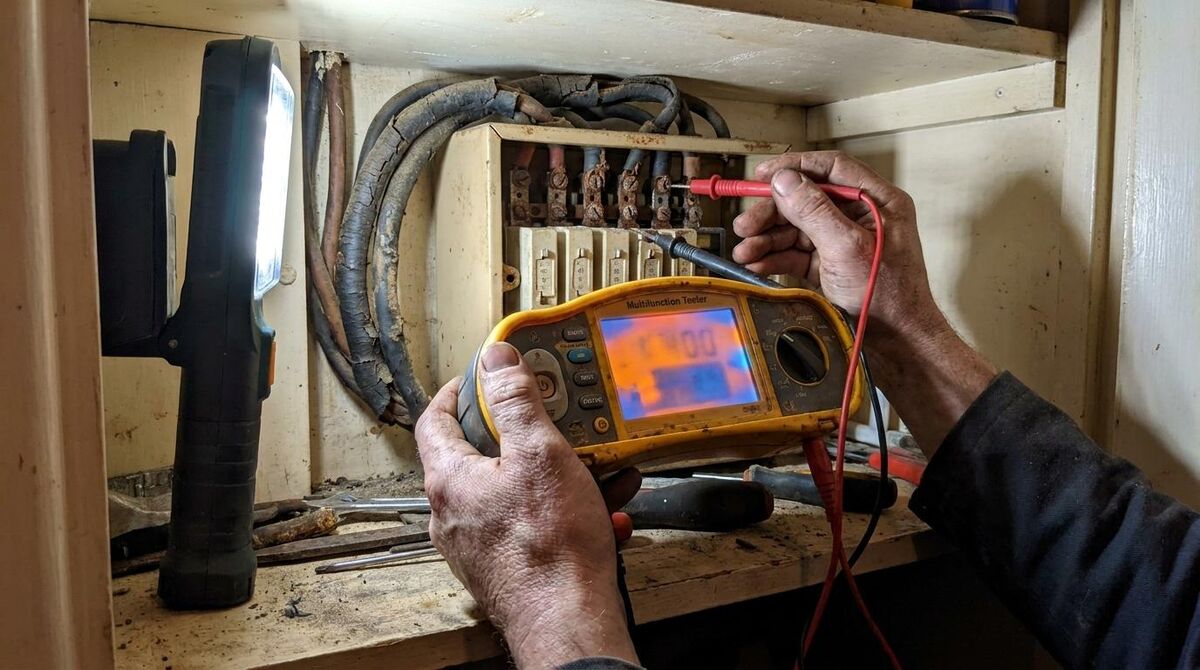
Take insulation resistance. The minimum a circuit can read and still pass is 1 megohm at 500V DC. Fine. But a reading between 1 and 2 megohms on wiring that is thirty-odd years old is not "fine", it is an installation whose insulation is approaching the end of its life. It passes. It is technically satisfactory. And if the last inspection recorded that same circuit at 50 megohms and this one records 1.4, you are not looking at a pass, you are looking at a collapse in slow motion that happens to have crossed the line on the right side this year.
Now multiply that by a stock of a few thousand homes built in the same decade by the same contractor to the same spec. They do not deteriorate at random. They deteriorate together. That is the trend. And the reason your team cannot see it is not incompetence, it is that every certificate is read on its own, signed off on its own outcome, and filed. Nobody stacks them up and looks across the stock, because the outcome column already said the magic word. I wrote about this blind spot from the regulator's side in what the Regulator of Social Housing's inspector actually looks for in your compliance records, and it is the same failure viewed from a different chair.
What you need before you start
You do not need a data science team. You need your existing certificates and the discipline to read them properly. Here is the honest list.
- Your EICRs in digital form. PDFs are fine to start, though you will curse them.
- The schedule of test results from each one, not just the observations page. This is the part most people skip.
- A way to record observation-level data: at minimum a spreadsheet, ideally a database or a platform that reads the certificates for you.
- Property attributes you almost certainly already hold: build era, archetype, original wiring contractor if you know it, previous EICR date and result.
- A copy of BS 7671 and a codebreakers guide so your coding is consistent. Inconsistent coding is the single fastest way to poison your own dataset.
That last point is not optional. If one inspector codes a missing RCD as a C2 and another codes the identical situation as a C3, your trend data is noise. Consistency of coding is a governance job, not an electrical one, and it sits with you.
The method: reading the trend hiding in your EICRs
Six steps. None of them are clever. All of them are things your team is not doing, which is exactly why the trend stays hidden.

Step 1: Stop reading the outcome, start reading the observations. Ban the word satisfactory from your reporting for a week. Force every report to be summarised by its observations instead. You will immediately notice that "satisfactory" homes are carrying two, three, five C3s each, and that the same C3s keep appearing.
Step 2: Extract observation-level data, not certificate-level. The unit of analysis is the observation, not the report. Every C3 has a description and, if the inspector did their job, a BS 7671 regulation reference. Pull each one out as its own row, tagged to the property. One EICR might give you six rows. That granularity is the whole game.
Step 3: Code every observation to its regulation reference. "No RCD protection to socket outlets" maps to a specific regulation. So does "no main protective bonding". Standardise the descriptions to their references so that ten inspectors describing the same fault ten different ways all collapse into one countable category. If you have ever tried to do this by hand across thousands of PDFs you will understand why I ended up building software to extract it; I go into that in what the PropTech vendors will not tell you about AI document extraction.
Step 4: Count by observation type across the whole stock. Now you can ask the question that certificates on their own can never answer: of my 4,200 homes, how many carry this exact observation? When one C3 shows up on 60 percent of a build archetype, you are not looking at a maintenance item, you are looking at a design characteristic of a whole cohort of your stock that is going to age as one.
Step 5: Trend the test results, not just the codes. This is the step that separates people who understand their stock from people who file it. Go into the schedule of test results and pull the numbers: insulation resistance per circuit, earth fault loop impedance (Zs), RCD trip times. Compare this cycle to the last. A code is a snapshot. A test value with a direction is a forecast.
Step 6: Segment by archetype, era and original contractor. Slice every count and every trend by build era, property type and, where you have it, the firm that did the original install. Deterioration clusters by cohort. The moment you segment, the flat average that hid everything breaks apart and the at-risk cohort jumps out.
Worked example: 4,200 satisfactory EICRs, one hidden trend
Let me make this concrete with representative figures. Say you are the duty holder for 4,200 homes and every single one has an in-date, satisfactory EICR. On the certificate outcomes alone, you are 100 percent compliant and you would be forgiven for moving on. Now run the six steps.

You extract the observations and one cohort leaps out: roughly 1,600 homes from a late-1970s build programme, same original contractor, same consumer unit spec. Across that cohort the numbers look like this once you aggregate them.
| Observation (all coded C3, all "satisfactory") | Share of the 1,600-home cohort | Direction of travel |
|---|---|---|
| No RCD protection to socket-outlets | 61% | Static, but a C2 the day a socket feeds outdoor equipment |
| Insulation resistance recorded 1–2 MΩ on final circuits | 38% | Falling: cohort median down from ~50 MΩ last cycle |
| Rubber or early PVC cabling nearing end of life | 29% | Falling, and it does not recover |
| No main protective bonding to services | 17% | Static, but never gets better on its own |
Read those rows properly. The insulation resistance one is the alarm. Thirty-eight percent of the cohort is already sitting between 1 and 2 megohms, and the cohort median has fallen from around 50 megohms at the last inspection to barely above the pass line at this one. Insulation does not heal. Project that same slope forward one five-year cycle and a large slice of those 600-odd homes drops below 1 megohm. Below 1 megohm is no longer a C3. It is a C2, potentially a C1 where it coincides with other faults, and it arrives with a 28-day remedial clock and a tenant who has a legal right to a copy of the report within 28 days.
Nothing in that example required a single unsatisfactory certificate. Every home was compliant the whole way through. The deterioration was always in the data. It just was not in the outcome, and the outcome was the only thing anyone was reading.
The three deterioration signals teams miss
Falling insulation resistance on a cohort. Not one property, a cohort. A single low reading is a maintenance job. A cohort-wide downward slope is a capital programme you have not budgeted for yet. Trend the medians by archetype every cycle.
Rising Zs against the maximum permitted values. Earth fault loop impedance creeping upward toward the BS 7671 limits means disconnection times are getting closer to the edge. It rarely trips a code on its own until it breaches, so it hides beautifully inside a satisfactory report. Watch the gap between measured Zs and permitted Zs narrowing across cycles.
The same C3 on the same cohort. When one observation appears on more than half a build archetype, it has stopped being a defect and become a characteristic. Those are the observations that move together, and moving together is precisely what makes them a programme-level risk rather than a job ticket.
Common mistakes reading EICR data
Treating the outcome as the data. The outcome is a verdict, not evidence. If your compliance dashboard shows a percentage of satisfactory certificates and nothing else, you have built a system that is structurally blind to the exact thing you most need to see.
Ignoring the schedule of test results. The observations page tells you what the inspector chose to flag. The schedule of test results gives you the raw measurements, and the raw measurements are where trends live. Skip it and you have thrown away the most valuable part of a document you paid a few hundred pounds for.
Accepting inconsistent coding. If your contractors code the same fault differently, no amount of clever analysis afterwards will save you. Fix coding consistency at the point of inspection with a clear codes policy. This is a governance failure dressed up as a technical one, and it is yours to solve. It is the same discipline I covered in the run-up to the Level 3 qualification becoming mandatory for EICRs: competence and consistency at the point of inspection is where data quality is won or lost.
Trusting "LIM" and blank test cells. When you see limitation notes or empty cells across the schedule of test results, that is not a clean bill of health, it is a test that did not happen. A satisfactory outcome sitting on top of untested circuits is worse than an honest unsatisfactory, because it tells you to relax.
What duty holders and sparks are saying
Recommended videos

EICR Codes Explained: C1, C2, C3 & FI (What They Actually Mean)
Sparks Will Fly Electrical

EICR Codes EXPLAINED (C1, C2, C3 & FI) | UK Apprentice Guide
Royale Installation

EICR Codes in the On-Site Guide to BS 7671
James Curnow
How to Do an EICR Start to Finish: Electrical Safety Inspection and Test
Mark The Sparky Allison

Ultimate Guide to EICR Testing
Finney Electrical
EICR Walkthrough: Periodic Electrical Inspection & Testing
Artisan Electrics
Frequently asked questions
It means the installation met the standard on the day, with no C1, C2 or FI. That is not the same as safe or healthy. Compliance is not assurance. A satisfactory report can sit on top of circuits that are one cycle away from a C2, and the outcome word will never tell you that.
No. You can have as many C3s as you like and the report is still satisfactory. That is exactly why C3s are the code to watch. They record real departures from the current standard while giving everyone permission to ignore them.
Because 1 megohm is a floor, not a target. A reading of 1 to 2 megohms on old wiring passes but signals insulation near the end of its life. Track the trend across cycles. A circuit that fell from 50 megohms to 1.4 is failing in slow motion, it has just not crossed the line yet.
No, you can start with a spreadsheet and your existing certificates. Software earns its place when you are doing this across thousands of PDFs and cannot afford to read each one by hand. Start manual on one cohort, prove the value, then decide whether to scale it.
At least every five years, in line with the regime that extended to the social rented sector from November 2025 and applies to all existing tenancies from May 2026. You also have to get a copy of the report to the tenant within 28 days and complete remedials within 28 days of an inspection.
Pick one build archetype and pull the insulation resistance readings from this cycle and the last. If the cohort median is falling, you have found a trend that certificate outcomes were hiding, and you have your first budget conversation.
My verdict
The word satisfactory has done more to hide risk in social housing than any dangerous fault ever has, because a dangerous fault gets fixed and a satisfactory certificate gets filed. You are already paying for the data. Around 300 checks per report, thousands of reports, and almost none of it aggregated. Read the observations, trend the test results, segment by cohort, and you can see the wave of C2s coming years before it lands. People can and will doubt the things you say. It is impossible to doubt what you do, so go and do the analysis, because the Regulator, the law and your tenants are all going to expect it whether you have done it or not.